From Concept to Contract: Conversations at the Army Demand Signal Forum | All About the Base
May 18, 2026 • 9:00 – 9:45 am EDT
Hosted by All About the Base

Photo: Alex Wong/Getty Images
The Trump administration announced new across-the-board tariffs on April 2, ranging from 10 to 49 percent depending on exporting country, which are now subject to reevaluation during a 90-day pause. If implemented together with other Trump administration tariffs, the average U.S. import tariff would rise almost tenfold to 17 percent.
On April 2, the Trump administration introduced new import tariffs across all sectors and trading partners. These tariffs range from 10 to 49 percent and are benchmarked to existing bilateral trade imbalances between the United States and trading partners.
These tariffs, together with previously announced tariffs on imports from China (20 percent), from Mexico and Canada (25 percent), and on all imports of iron, steel, aluminum, and cars (25 percent), bring the average U.S. import tariff across all goods and partners to 17 percent, an almost ten-fold increase since the start of the Trump administration and a level not seen since the 1910s (Figure 1).
As of April 9, 2025, these tariffs have been put on hold for 90 days for further evaluation. Careful economic analysis of such import tariffs requires the use of a computable general equilibrium trade model to examine impacts on bilateral trade flows around the world, country economic outcomes (i.e., prices, wages, and GDP), and resulting government revenues. CSIS and UCSB have developed such a model for trade policy analyses (see details in the Appendix). We model the proposed April 2 tariffs, sectoral exemptions announced that day, as well as previously introduced iron, steel, aluminum, and car tariffs since January 2025. We do not model any retaliatory tariffs nor the 10 percent across-the-board tariff that is applied during the 90-day pause period.

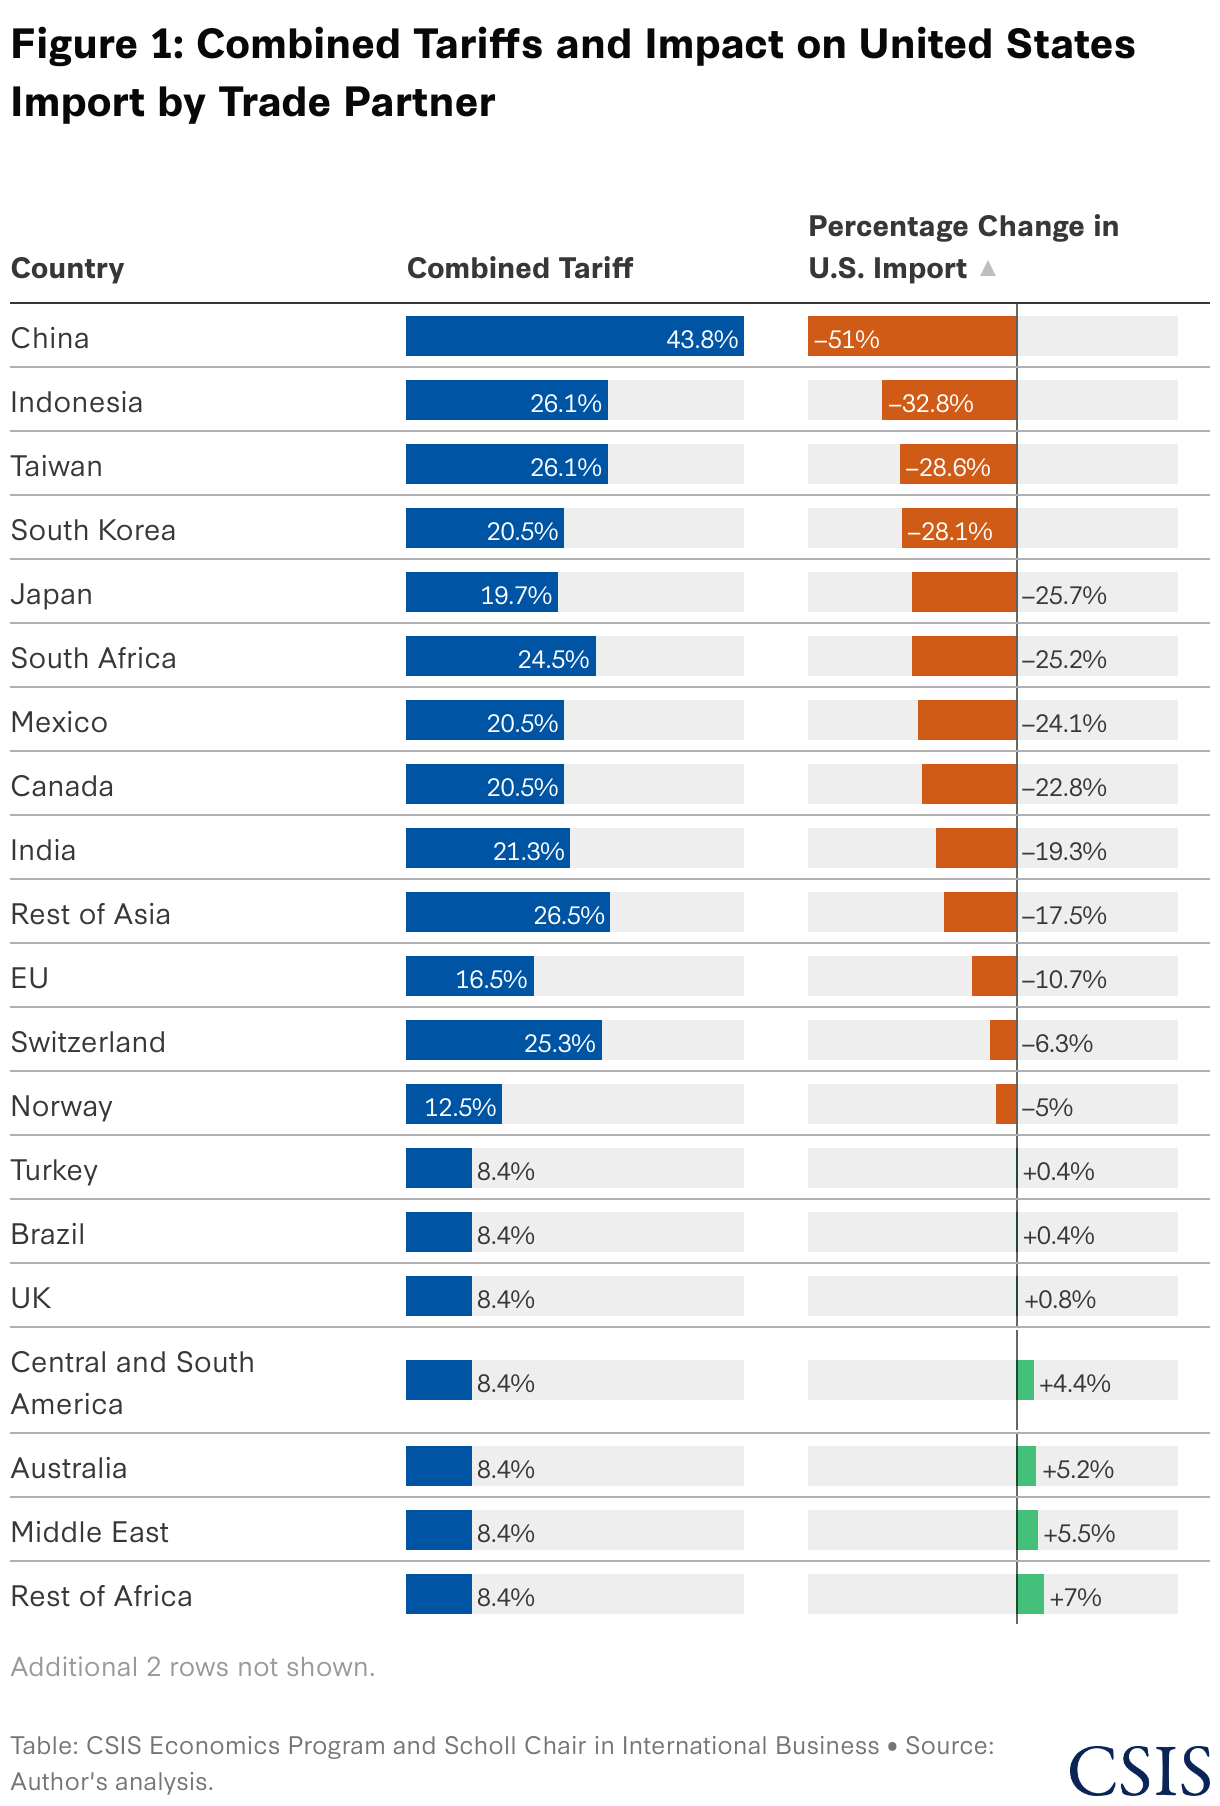
Our analysis shows that proposed tariffs would lower U.S. imports on average by 11 percent across trading partners, with substantial differences across trading partners (Figure 1). Foreign countries facing higher tariffs decrease U.S. imports between 5 percent to 51 percent, while countries with low or zero tariffs see U.S. imports increase between 0.4 percent to 16 percent.
Tariffs would alter wages, prices, and GDP around the world. We find that the aggregate price of goods in the United States would increase by 7.1 percent while U.S. wages would rise by 6.3 percent, resulting in a drop in real wages (Figure 2). For foreign countries and regions, lower U.S. demand would induce prices to fall by 1.2 percent on average and decrease wages by 1.4 percent on average.

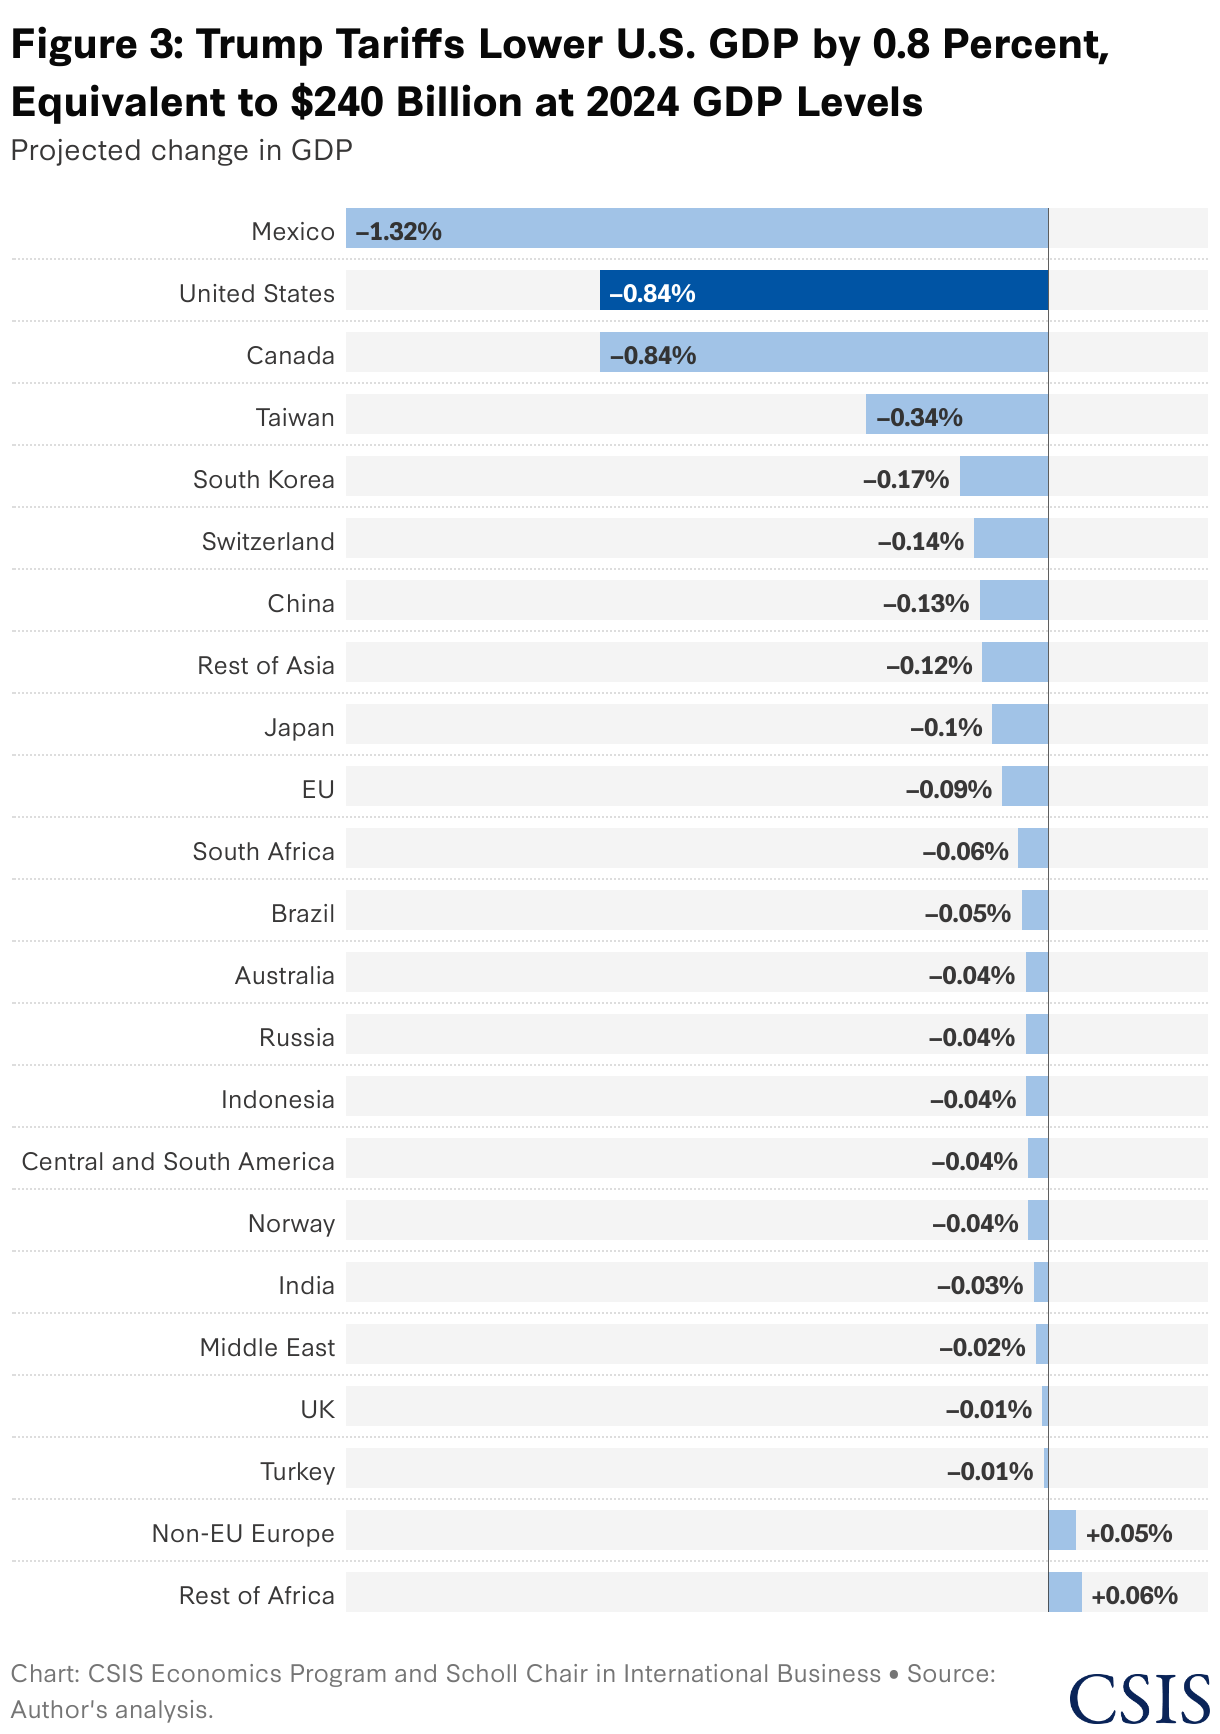
This would impact aggregate GDP. The proposed tariffs would lower U.S. GDP by 0.8 percent, equivalent to a $240 billion annual output loss. They would also lower the GDP of foreign countries on average by 0.16 percent, with Canada and Mexico experiencing greater than 0.8 percent GDP declines (Figure 3).
Altogether, the tariffs would raise $500 billion in annual gross revenue. If one were to adjust for an assumed 10 percent noncompliance rate and a 24 percent income and tax offset as estimated by the Congressional Budget Office, the net annual tariff revenue would be $330 billion. By comparison, the long-run annual tariff revenue estimated by the Yale Budget Lab, a comparable estimate with similar adjustments, is $358 billion.
Finally, which products would experience the largest U.S. price increases? There is a wide range of price increases (Figure 4). We find that products experiencing U.S. price increases at least 15 percent include those in mining (e.g., nickel, zinc, and tin), metals (e.g., iron, steel, aluminum, and nickel electronics, food (e.g., fish, meat, and rice), and other industrial products (e.g., machinery, ceramics, and fuels).

There remains a lot of uncertainty regarding the Trump administration’s trade policies which will likely continue over the next three months as the administration evaluates and amends its proposals to date. General equilibrium trade modeling like this will be particularly valuable in understanding the U.S. and global economic consequences of these ongoing policy developments.
Kyle Meng is a senior associate (non-resident) with the Economics Program and Scholl Chair in International Business at the Center for Strategic and International Studies in Washington, D.C. and an Associate Professor of Economics at the University of California, Santa Barbara.
The analysis by CSIS and UCSB uses a global general equilibrium trade model. Specifically, we use a multisector Armington model with linear production, fixed sectoral expenditure shares, and no tax revenue recycling. The model is calibrated using Exiobase3 (Stadler et al., 2018), a multi-region input-output database with 200 sectors built, in part, on bilateral trade data from Comtrade. We employ sector-specific Armington trade elasticities estimated by Ossa (2015).
We jointly model the following components of the Trump administration’s ad-valorem import tariffs to date: (1) country-level tariffs on all goods imports in the April 2 announcement, (2) sector-level exemptions in the April 2 announcement, (3) sector-level 25 percent tariffs on iron, steel, aluminum, and cars from all countries, (4) 20 percent additional tariffs on all goods imports from China, and (5) 25 percent tariffs on all goods imports from Canada and Mexico.