Launching the International Call to Action for 6G Leadership and Security
July 29, 2026 • 9:30 am – 12:00 pm EDT
Hosted by Strategic Technologies Program

Photo: Photos for You/Getty Images
Since the war in Iran started on February 28, oil prices have moved considerably higher as the market has been forced to cope with an unprecedented supply disruption—more than 10 million barrels per day (mb/d) missing from global markets for more than 50 days. Oil prices have exhibited high volatility during this period, surging on reports of damage to infrastructure and shipping, and receding with news about diplomatic progress toward ending the war. From the outside, it appears that there are two distinct oil markets with separate but related pricing dynamics: the physical oil market and the financial, or “paper,” market. This Critical Questions explains the differences and the relationship between them, and suggest that the former is the better gauge of changing supply-demand balances during these extraordinary circumstances.
Q1: What is the difference between “physical” and “paper” oil prices?
A1: Physical oil prices are paid by parties making and taking delivery of real barrels of oil within the next two to four weeks. Those include oil sellers, such as U.S. oil producers and the national oil companies of the Organization of the Petroleum Exporting Countries (OPEC) states, and their consumers, which, for crude oil, are refiners. The most important physical oil price is Dated Brent, which represents the price of North Sea crude oil. Many other types of crude oil, such as Iraq’s Basra oil (delivered to Europe) and Russia’s Urals crude, are priced with a premium or discount to Dated Brent.
For example, Nigeria’s Forcados crude oil recently transacted at around Dated Brent plus $6.5 per barrel, reflecting the specific composition and refinery yield of Forcados as well as its availability, shipping cost, and other factors.
“Paper” oil prices are usually those of financial contracts that reference oil to be delivered in some future month. The two most important “paper” prices are the futures contracts for Brent and for West Texas Intermediate (WTI) that are offered on the Intercontinental Exchange (ICE) and the Chicago Mercantile Exchange (CME). Other types of contracts in the “paper” oil markets are oil options—also offered on the commodity exchanges—and oil swaps, which are largely private bilateral transactions on the “over-the-counter” (OTC) market.
Q2: Who are the participants in these two markets, and how do they use them?
A2: Oil producers, refiners, and middlemen traders are the physical market participants, setting the prices for physical oil transactions. Paper markets, on the other hand, are used for hedging (price risk management) and for proprietary speculative trading. The key difference is that paper market trading rarely involves receiving or delivering physical oil; its financial market participants usually cancel obligations with offsetting contracts prior to expiry, obviating the need for making or taking delivery.
Hedging utilizes paper market contracts to manage risk, which is done by both sellers and buyers. For example, an oil seller faces downside price risk—if oil prices decline in the future, its revenue will too. It can lock in today’s prices by selling oil futures as a hedge against that potential price decline. A refiner, on the other hand, faces risk with higher crude prices, so it hedges by buying crude futures contracts.
For refined oil products like gasoline, diesel, and jet fuel, the refiner is the seller, so it hedges against price declines in those fuels while its customers, for example, airlines, face upside price risk and so would hedge against fuel price increases.
Proprietary or speculative trading is akin to betting on price moves based on an investment thesis, usually around an in-house view about oil supply-demand fundamentals.
Q3: What is the typical variance between the two oil prices, and what is unusual about the spread during this crisis?
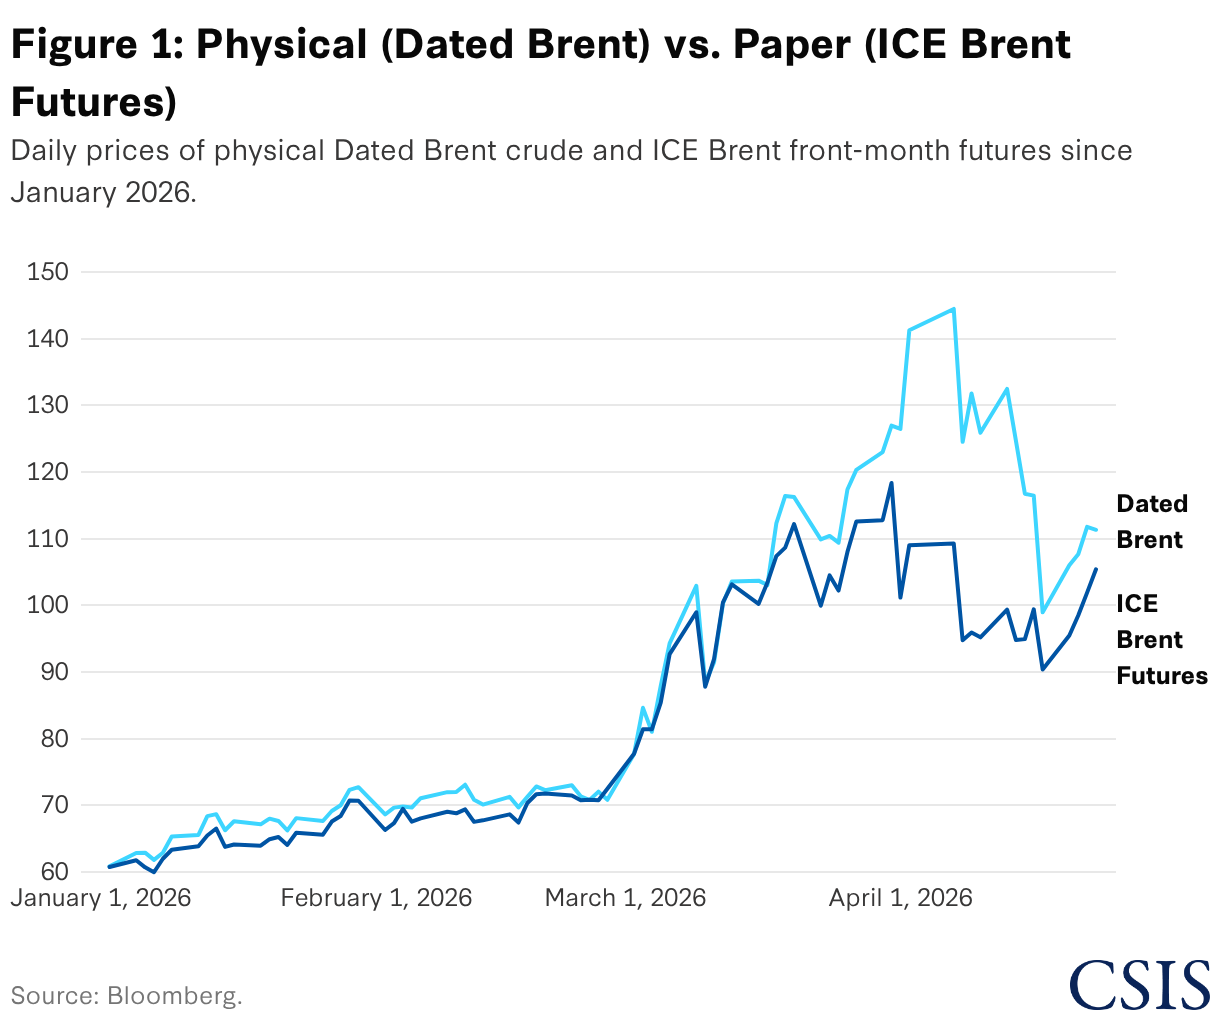
A3: Physical and futures market prices move in tandem, with typical differences measured in just cents per barrel, converging as futures contracts approach expiry (see Figure 1)
However, under exceptional circumstances such as the current Middle East Gulf export disruption, which has halted more than 10 mb/d, the two prices can diverge substantially. One reason is that refineries are desperate to acquire sufficient crude feedstocks to keep their units running and avoid expensive run cuts or plant shutdowns. Another reason is that many noncommercial traders in the futures markets are wary of downside “headline” risk that can cause financial losses from a single social media post and prefer to stay more neutral than physical traders who require oil on hand. This has likely left traders with a downside price bias with significant influence in paper markets.
In times like these, oil for delivery soon can trade much higher than the futures markets, such as the extraordinary $30 differential recorded in early April.
Q4: What is this historic variance telling us about the market impact of this crisis?
A4: Unlike the 2007–2008 price escalation, caused by an explosion of demand led by China, the United States is now experiencing a classic 1970s-style supply shock that is poised to leave global inventories depleted, with refineries unable to source enough affordable crude oil and certain regions running short of fuels for transportation and—in some Asian markets—cooking.
Physical and paper markets are both reflecting the historic nature of the current supply disruption—over half a billion barrels so far withheld from world markets—for which no policy response can fully offset. Neither supply-side measures like drawdowns of strategic reserves and the waiver of the U.S. Jones Act regulations, nor demand-side changes to taxes and subsidies, can completely mitigate the economic damage from this disruption.
Market observers are anticipating that oil prices could reach “demand destruction” levels—so high as to cause consumers and businesses to pull back on oil consumption—to rebalance supply and demand. This will occur in the physical oil market, not the futures market. And initial signs indicate this may already be happening, as physical crude prices recently near $150, and prices for jet fuel in Asia above $200, could already be curtailing oil demand relative to prewar patterns.
Q5: What additional policy measures are being undertaken to protect consumers and businesses?
A5: Dozens of governments have announced market interventions, many of them price caps and fuel subsidies, to shield their constituents from runaway energy prices caused by the war. Broad price interventions (rather than steps focused on especially vulnerable cohorts) run the risk of “moral hazard,” shielding buyers from market signals needed to change behaviors, thus ultimately exacerbating the crisis. Other steps, like governmental initiatives to reduce electricity use for air conditioning and lighting, are underway in some Asian nations.
Q6: What are the risks for market observers in referencing paper prices at a time like this?
A6: Because physical and paper oil markets usually trade at very similar levels, and because futures prices are published by the exchanges in near real time, affording universal access in news media and online, financial markets and investors have come to believe that futures prices (like front-month Brent and WTI) are the price of oil. But in times like these, paper markets can send a false signal that oil markets are less tight than they really are. Looking at the $98 average front-month Brent futures price since March 1, one might conclude that the price spike has not been too bad, especially since Brent futures hit $139 as recently as March 2022. But the moderate futures prices are masking the much higher prices being paid for physical oil, with Dated Brent having averaged $111 since March 1, and some grades of oil trading more than $20 higher than that.
Q7: Under what conditions will the physical vs. paper price differential resolve, and what will that mean for retail prices of gasoline and diesel, and for jet aviation fuel?
A7: Both physical and paper oil market prices will fluctuate with expectations for Gulf exports to resume, and an eventual restoration of regional supply flows will reduce prices in both categories. But paper markets are likely to sell off harder than physical markets, which will be stuck with disrupted supply chains (shut-in oil wells, insufficient empty tankers to resume prewar volumes) for months after the war ends. As a result, the prices of gasoline, diesel, and jet fuel will stay higher for longer than oil futures.
Adi Imsirovic is a senior associate (non-resident) with the Energy Security and Climate Change Program at the Center for Strategic and International Studies (CSIS) in Washington, D.C. Clayton Seigle is a senior fellow in the Energy Security and Climate Change Program and holds the James R. Schlesinger Chair in Energy and Geopolitics at CSIS.

Commentary by Clayton Seigle — March 25, 2026

Critical Questions by Clayton Seigle — March 9, 2026

Critical Questions by Clayton Seigle — April 8, 2026