The Futures Summit: A New Era of Development Cooperation
April 10, 2026 • 8:30 am – 4:30 pm EDT
Hosted by Global Development

Photo: agratitudesign/Adobe Stock
Gray zone activity is a constant in modern great power competition. Authoritarian states use indirect ways and means that fall beneath the threshold of armed force to set conditions for both future military operations and long-term coercive campaigns. This approach, termed “advancing without attacking,” is a central feature of how the Chinese Communist Party (CCP) pressures Taiwan and other states.1 China has waged disinformation campaigns around Taiwanese elections, stolen intellectual property to accelerate its technological rise, and seized disputed border territory by quietly building villages, all while avoiding direct military confrontation.2 These operations often rely on ambiguity, plausible deniability, and the strategic use of nonmilitary assets.3
In the maritime domain, China has consistently used civilian vessels—especially fishing boats—as tools of statecraft in contested waters.4 While analysts have focused heavily on the People’s Liberation Army Navy (PLAN) maneuvers near Taiwan, less attention has been paid to the role of unmarked or dual-use vessels operating in parallel with the PLAN. These ships can, and do, conduct surveillance, harass foreign vessels, and reinforce territorial claims under the cover of commercial activity. Examples include using civilian ships to drop anchors and thereby sever undersea cables, deploying fishing fleets to overfish and damage maritime habitats, and leveraging dual-use infrastructure to project a coercive presence.5
Yet, how can policymakers and national security analysts separate this maritime gray zone activity from international trade and commerce? How can intelligence agencies and the U.S. Department of Defense (DOD) at large collaborate to identify specific vessels while facing large volumes of data under budget constraints? To answer these questions, the Futures Lab proposes a classification framework that combines geospatial data with behavioral, time, and vessel attribute manipulation to flag vessels engaging in suspicious activities. This report examines how China may be using ostensibly civilian maritime assets as part of a coordinated campaign around Taiwan that combines coercion and intelligence operations to set operational conditions in the event of direct conflict.
Specifically, this study profiles vessels in two ways. First, it examines fishing vessels that spend significant time in military drill zones without engaging in active fishing, as they are more likely to be participating in state-directed gray zone activity. The second profile encompasses purported fishing vessels that exhibit AIS anomalies—such as going dark, changing identifiers, or reducing or attempting to mask their AIS movements—while in or near known drill areas. These behaviors may be attempts to mask the vessels’ movement to avoid scrutiny, and they suggest that these ships are likely to be engaging in gray zone activity. The classification framework used in this study whittled down nearly 12,000 vessels traveling near Taiwan to an estimated 128–209 ships that fit into one (or both) of the two profiles and, thus, are likely engaged in gray zone activities. In addition, using a geospatial approach to measure the concentration of positions, the research team highlighted the study’s classification framework findings of one specific profiled vessel, demonstrating that the vessel had, in fact, spent the vast majority of its time in known Joint Sword drill zones.6 In effect, the classification framework cuts down on the man-hours needed to analyze vast quantities of data, positioning federal intelligence analysts responsible for maritime security in East Asia to be able to quantify gray zone activities.
By analyzing patterns of maritime activity in relation to military drill zones and fishing areas, the CSIS Futures Lab explores new, data-driven methods for analyzing gray zone activity. The intent of this study is to spark a more active range of public efforts to identify malign activity in the Indo-Pacific.
This report proceeds in four sections. First, it outlines a data-driven classification framework for identifying suspicious vessel behavior by analyzing patterns of movement within known PLAN drill zones and commercial fishing hotspots. Second, it applies this framework to a dataset of nearly 12,000 vessels, narrowing the list to a subset of ships exhibiting suspicious loitering and non-fishing behavior, thereby offering a scalable way to identify potential gray zone actors. Third, the report expands the analysis to include AIS anomalies, such as going dark and changing identifiers, thus further validating behavioral suspicion through AIS manipulation. A detailed case profile illustrates how these indicators align in practice, validating the results of the classification framework proposed here. Finally, the report presents four actionable policy recommendations designed to operationalize these findings: establishing a joint maritime anomaly cell; publishing and punishing a blacklist of repeat offenders; creating a Taiwan transparency dashboard; and commissioning an annual gray zone threat estimate and methods to close the collection gap. Together, these recommendations offer a scalable model to turn open-source data into a tool to deter gray zone activities by detection.
Countering the CCP’s ability to conduct gray zone and other intelligence operations using commercial maritime vessels requires developing analytical methods for separating the signal from the noise. The questions become: (1) When is a commercial ship potentially operating on behalf of the People’s Republic of China (PRC); and (2) when is it, like the vast majority of maritime activity, simply engaged in commerce?
This task is complicated by the nature of gray zone campaigns. The U.S. National Intelligence Council defines the gray zone as a space “between peaceful diplomacy and open warfare” where states and non-state actors use subversive, often deniable, means to impose costs, shift balances of power, and undermine international norms.7 Gray zone activities can be legal or illegal, violent or nonviolent, but they all share one trait: They exploit ambiguity to achieve geopolitical goals. Under the rule of Xi Jinping, the PRC has intensified gray zone activities across East Asia and beyond. Its tactics range from dual-use coercive infrastructure development to disinformation campaigns, limited border skirmishes, and cyberattacks.8 These examples represent a sustained use of statecraft and sub-threshold aggression under hybrid warfare. Nowhere is this Chinese strategy of “advancing without attacking” more visible than in China’s maritime operations.
Fishing boats, cargo ships, and other ostensibly civilian vessels are repurposed to carry out surveillance, harassment, or presence operations in contested waters.9 In the South China Sea, this tactic is well documented, with China using its maritime militia—fishing fleets that swarm disputed reefs, block foreign vessels, or shadow naval ships—all without military insignia or PLA flags.10 To explore this activity, the Futures Lab research team treats gray zone vessel activity as a plausibility case study to test whether real-world vessel behavior aligns with theoretical expectations of covert state-aligned action.11
To that end, this study argues that Chinese civilian vessels can be deemed an extension of China’s gray zone activities if they significantly operate in non-normal areas—specifically, areas in which the vessel is likely not engaged in its purported purpose (e.g., a fishing boat spending significant time in water which is not a fishing hotspot). This leads to two key arguments. First, fishing vessels that spend significant time in military drill zones without engaging in active fishing behavior are more likely to be participating in state-directed gray zone activity. If fishing vessels are being repurposed for gray zone activity and pressure campaigns, one should observe statistically unusual behavior in terms of location, visibility, and timing relative to Chinese military actions. That is, these otherwise commercial fishing vessels will be outside of fishing hotspots and/or operating in the vicinity of major exercises around Taiwan.
Second, assuming those dual-use vessels can be flagged, the team expects further anomalies from them, particularly in their behaviors regarding AIS messages. To this end, vessels that exhibit AIS anomalies such as going dark, changing identifiers, or reducing or attempting to mask their AIS movements in or near known drill areas are more likely to be engaging in gray zone activity. Manipulating vessel AIS messaging is a known technique to hide in plain sight and engage in numerous illicit activities (e.g., illegal fishing, drug smuggling, oil and arms ship-to-ship transfers, human trafficking).12 If these vessels are engaging in suspicious activity, in addition to their movements, they will attempt to deceive authorities by not only turning off their AIS but also by changing their names to disguise themselves as another ship or floating object (e.g., an AIS buoy or a net). With this masking behavior, such vessels can potentially increase their illegal activity without getting caught.
To differentiate between suspicious activity and normal fishing activity, the CSIS Futures Lab began by acquiring access to Automatic Identification System (AIS) data for maritime vessels. AIS data is used to track vessel movement and provide identifiable information for maritime vessels, including but not limited to unique identifiers such as Maritime Mobile Service Identity (MMSI), country flags, speed on ground, course on ground, and vessel type (e.g., fishing, military, pleasure, law enforcement, and cargo).13 To analyze the data, the research team used the software platform Optix by General Atomics Intelligence, which sources its AIS data from Spire,14 as well as historical AIS information on vessel activities.15 The activities module from Optix enhanced the AIS vessel data by capturing when vessels turn off their AIS transponder (go dark), turn it on (go bright), make port calls, or conduct an attribute change like changing their vessel name.16 Tracking these activities aids the study of vessel movement and suspicious activity in three ways: (1) The data has more continuous tracking data points even if a vessel turns its transponder off; (2) if a vessel is conducting illegal or gray zone activity, it may attempt to hide its activity by dampening its signals when a vessel turns its AIS transponder off, serving as a potential indicator; and (3) a vessel may attempt to change an attribute—be it its name or the flag it sails under—to impersonate or otherwise disguise its identity from authorities. The AIS data serves as a foundation to identify vessels of interest in or near the Taiwanese and Chinese exclusive economic zones (EEZs), Taiwan’s de facto Air Defense Identification Zone (ADIZ), known blockade-drill areas of operation, and likely fishing hotspots.
With access to time series AIS data established, the team next gathered vector shapefile data from the open-source reporting website geoint.asia.17 Available data included areas of operations (AOs) for drills conducted in August 2022 and Joint Sword (JS) A and B, as well as Chinese Coast Guard (CCG) formations and their locations during JS B. The spatial data on drills, in outlining areas of military activity, aid in the identification of vessels operating in or near those areas by the PLAN and CCG. The next stage for vessel identification was to use Optix to run geospatial and time series queries.18 At this stage, the team identified vessels within known exercise areas of PLAN and CCG drills; the final piece was acquiring the data needed to differentiate between normal activity—in this case, fishing—and suspicious or gray zone activity.
To assess normal versus abnormal behavior, the team employed data from Global Fishing Watch’s (GFW) public datasets. GFW analyzes AIS data collected from known or possible commercial fishing vessels and applies a fishing detection algorithm to determine “apparent fishing activity” based on changes in vessel speed and direction.19 The algorithm classifies each AIS broadcast data point for these vessels as either apparently fishing or not fishing, measured in fishing hours per spatial cell.20 To compare vessels detected in the AIS sample with general patterns of fishing activity, the research team processed the 2024 GFW fishing effort dataset.21 This facilitated the extraction of the local fishing activity level for each vessel point. In turn, this data enabled the labeling of each AIS ping based on the fishing context in which it occurred. Points located in areas above the two-standard-deviation threshold of fishing effort were classified as occurring in hotspots, while those below the threshold were labeled as non-hotspot or low-effort regions. This classification allowed the Futures Lab to distinguish vessels exhibiting normal fishing behavior (e.g., fishing in known productive waters) from vessels operating in fishing-inactive areas—particularly when those areas overlapped with military exercise zones.
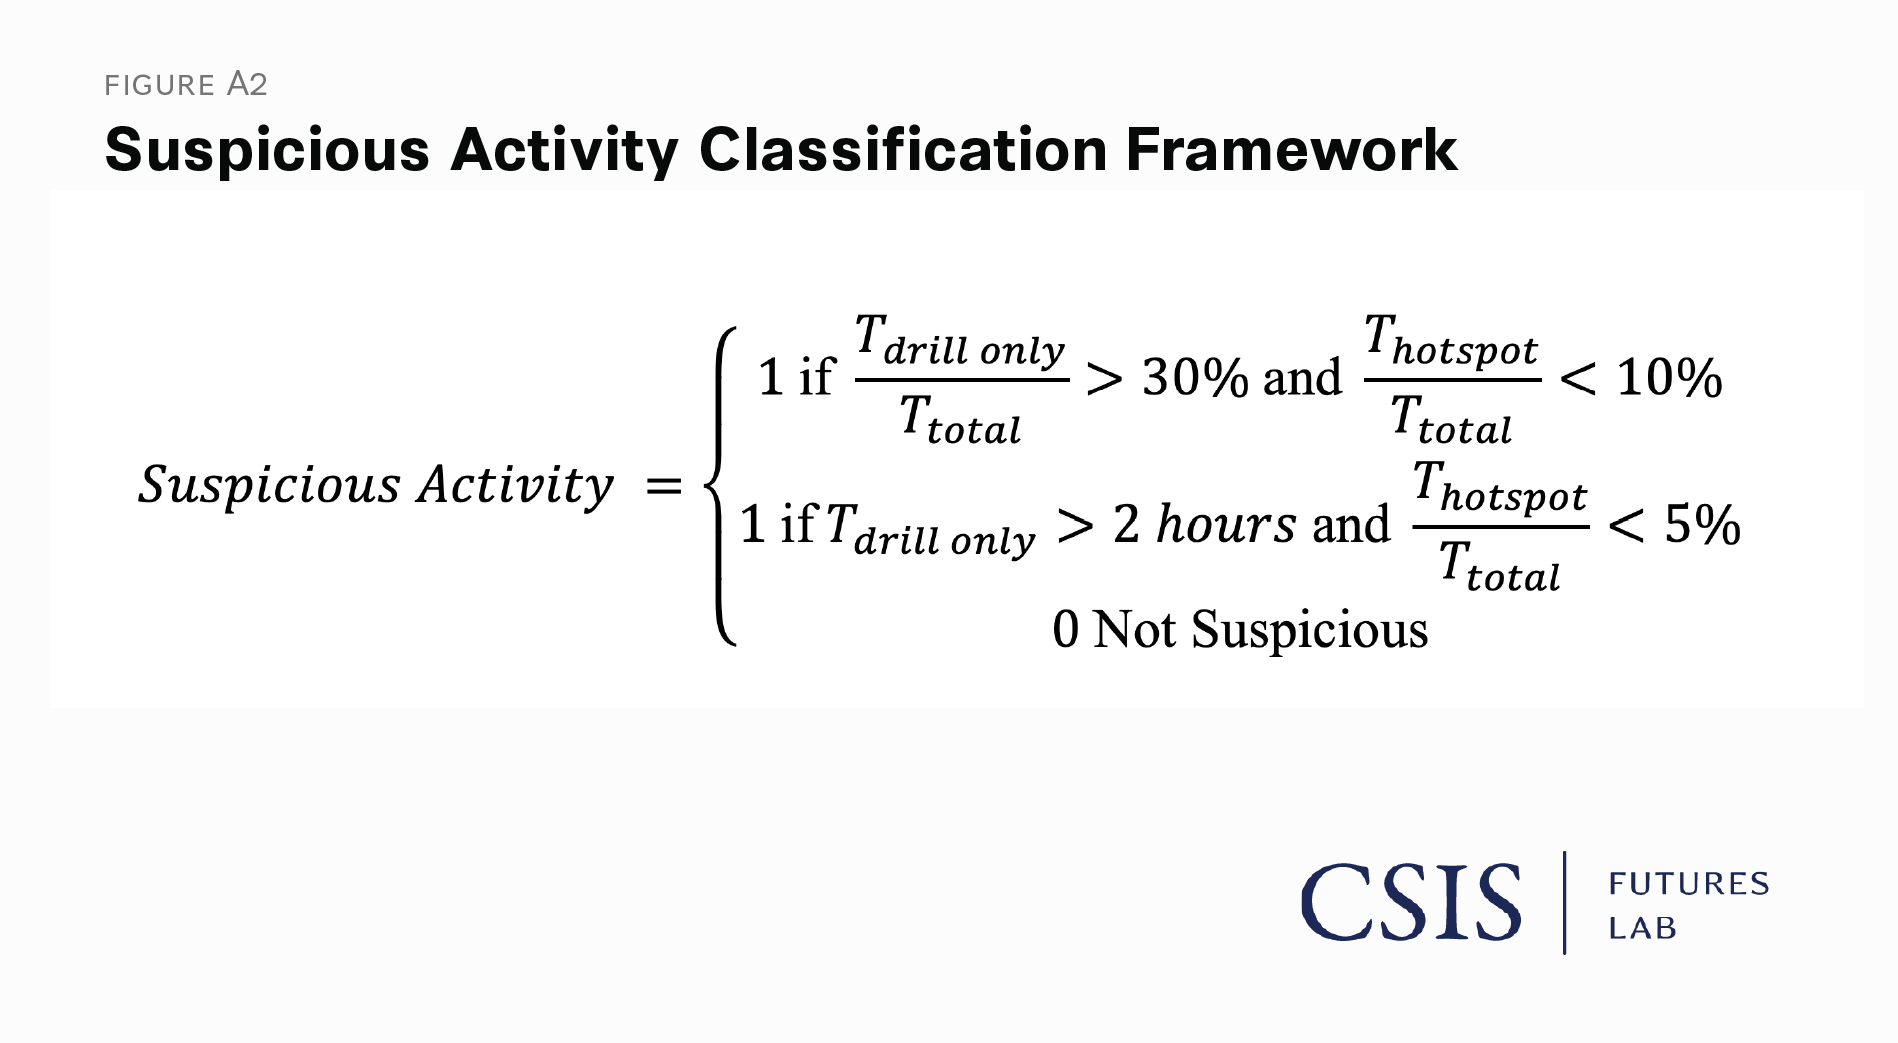
By integrating AIS data, Chinese military drill zone shapefiles, and Global Fishing Watch fishing effort data, the CSIS Futures Lab constructed a spatiotemporal behavioral profile for each vessel. The goal of the analysis is to differentiate between normal commercial fishing patterns and potentially suspicious activities, such as persistent presence in military areas with limited or no engagement in active fishing zones. The CSIS Futures Lab classified a vessel as engaging in suspicious behavior based on two primary criteria.22 The first is a behavioral proportion threshold based on evidence that commercial fishing vessels exhibit distinct spatiotemporal patterns, primarily within productive fishing zones, indicative of active fishing.23 Consequently, vessels spending more than 30 percent of their observed time within nonproductive areas, such as military drill zones, while simultaneously devoting less than 10 percent of their time to known fishing hotspots, display behavior that is highly unusual and potentially suspicious. The second is an absolute time threshold that combines a time‑based loitering indicator with fishing hours as a proxy for economic activity. Prolonged stays in non-fishing areas are uncommon among commercial fishing vessels and are indicative of anomalous behavior, with studies defining loitering events as lasting between three and four hours, depending on the study’s focus.24 Lastly, for vessels that did not meet either threshold, their activities were not flagged as suspicious, and they were assumed to be engaged in normal fishing behavior or transit.
The application of this classification to the data began by breaking down the 2024 dataset, which contained 11,895 unique MMSIs traveling near Taiwan. This subset reduced the data to 315 unique MMSIs reporting a country flag of China and identified as a fishing vessel. Next, the research team applied the behavioral and absolute time thresholds to detect suspicious vessels by generating variables that calculate time in fishing hotspots, in known PLAN Joint Sword A & B areas, and the overlapping time. The result in Table 1 is a conservative-estimation list of vessels that met the behavioral (74) or the absolute time (121) classifications, for a unique list of 128 out of 315 vessels that were labeled as engaging in suspicious activity.25 This approach reduces the high volume of data available to analysts studying these vessels and suspicious movements at sea to a more manageable amount. This is critical for the limited resources and budget constraints government agencies face in carrying out their mission sets.
Building on the behavioral classification, vessels engaged in gray zone activity are more likely to manipulate their AIS broadcasts—particularly by going dark, changing identifiers, or both—when operating near or within Chinese military drill zones. To test this assumption, the research team conducted a multipart anomaly analysis using the AIS dataset. The team isolated vessels with “go-dark” and “go-bright” events and then measured the duration of AIS silence on a per-vessel basis. The next step isolated dark events that occurred within known drill zones to calculate the total, average, and maximum number of minutes each vessel spent with its AIS off while in the Chinese military zones. This resulted in a measure both of the frequency and the intensity of suspicious non-reporting because AIS silence, particularly within drill zones, is inconsistent with normal commercial fishing behavior. Next, the research team investigated identity change sequences where a ship turned off its AIS signal, changed its name, and then reappeared, suggesting deliberate identity obfuscation. Leveraging the full distribution of average and total dark durations and vessel identify changes, the research team classified vessels exhibiting any of the following behaviors as “Going Dark,” marking them as anomalous and potentially deceptive:
This classification—combining spatial, temporal, and identification anomalies—reveals a new layer of behavioral deception. Table 2 summarizes these findings.
The vessels identified in Table 2 represent a conservative subset of maritime actors exhibiting behavior inconsistent with normal commercial fishing operations. The framework revealed 87 vessels that spent more time than average in AIS silence and an additional 12 vessels that stood out as statistical outliers based on dark-time duration. Notably, 209 vessels were observed changing their vessel name while either dark or immediately adjacent to periods of AIS silence—raising serious flags around identity manipulation. Taken together, the combination of loitering, signal suppression, and name changes—particularly inside or near Chinese military drill zones—offers strong empirical evidence of maritime behavior consistent with state-aligned or covert government operations. When layered with the spatial logic of the behavior and absolute classification described above, the patterns provide a systematic and, importantly, scalable model for identifying vessels that straddle the line between civilian and military domains.
While the Futures Lab’s classification framework offers a structured, data-driven method to identify potentially suspicious maritime behavior, several limitations merit acknowledgment. First, AIS data is vulnerable to manipulation and even intentional suppression, meaning vessels engaged in covert activity may go undetected during periods when their transponders are turned off. To mitigate this limitation, the included Optix activity data (e.g., “go-dark” or “go-bright” events) provide contextual insight even when AIS data is intermittent, reinforcing the framework’s ability to classify behavioral anomalies. Second, the thresholds used to flag suspicious behavior—such as spending 30 percent of observed time in drill zones—are a novel first step to identify potential gray zone behavior. Third, the framework classifies data solely based on spatial and temporal parameters; the research staff cannot directly observe vessel intent. Nonetheless, by triangulating across three independent data sources—AIS movement patterns, military drill zones, and Global Fishing Watch’s fishing effort—the study’s approach reduces the likelihood of coincidental overlap being misclassified as suspicious. Despite these limitations, the approach outlined in this report represents a scalable and transparent first step in quantifying gray zone activity using public data, offering actionable signals for policymakers and analysts.
To illustrate these gray zone patterns, the CSIS Futures Lab identified one of the suspected vessels as a case study and tracked its movements from January 2024 through December 2024 using Optix.26 The team chose this vessel from the suspected vessel list produced via the classification frameworks because it appeared under multiple MMSI identifiers and vessel names, without any recorded port-of-origin trail—behavior strongly indicative of intentional obfuscation. At various times, this vessel appeared briefly within Taiwan’s ADIZ, only to disappear from AIS detection shortly thereafter and with intermittent presence and unexplained absences from January 2024 to August 2024. This set of behaviors suggests two plausible scenarios: a small fleet operating under a shared MMSI identity, or a single vessel systematically switching identifiers to mask its activity. To evaluate this behavior, the research team identified MMSIs that were believed to be associated with the profiled vessel and manually recoded the 11 resulting MMSIs into a unified track for analysis.27
AIS signals linked to the profiled vessel were detected within the Joint Sword B area of operations, particularly during the drill period. Specifically, 25 AIS detections occurred on October 14, and over 180 on October 15, suggesting prolonged presence and heightened activity during key PLAN exercises. Of the 11 MMSIs associated with this case, the framework labeled 10 that met the behavioral proportion threshold, spending more than 30 percent of tracked time within drill-only zones and less than 10 percent in fishing hotspots. All 11 MMSIs met the absolute time threshold, exceeding two hours within drill zones while spending less than 5 percent of the time in fishing areas. In addition, the vessel changed its name more than 1,300 times over the course of the year and went dark an estimated 998 times. This consistent pattern of activity across all identifiers reinforces the likelihood that these MMSIs represent either a single platform or a coordinated maritime operation engaged in gray zone behavior.
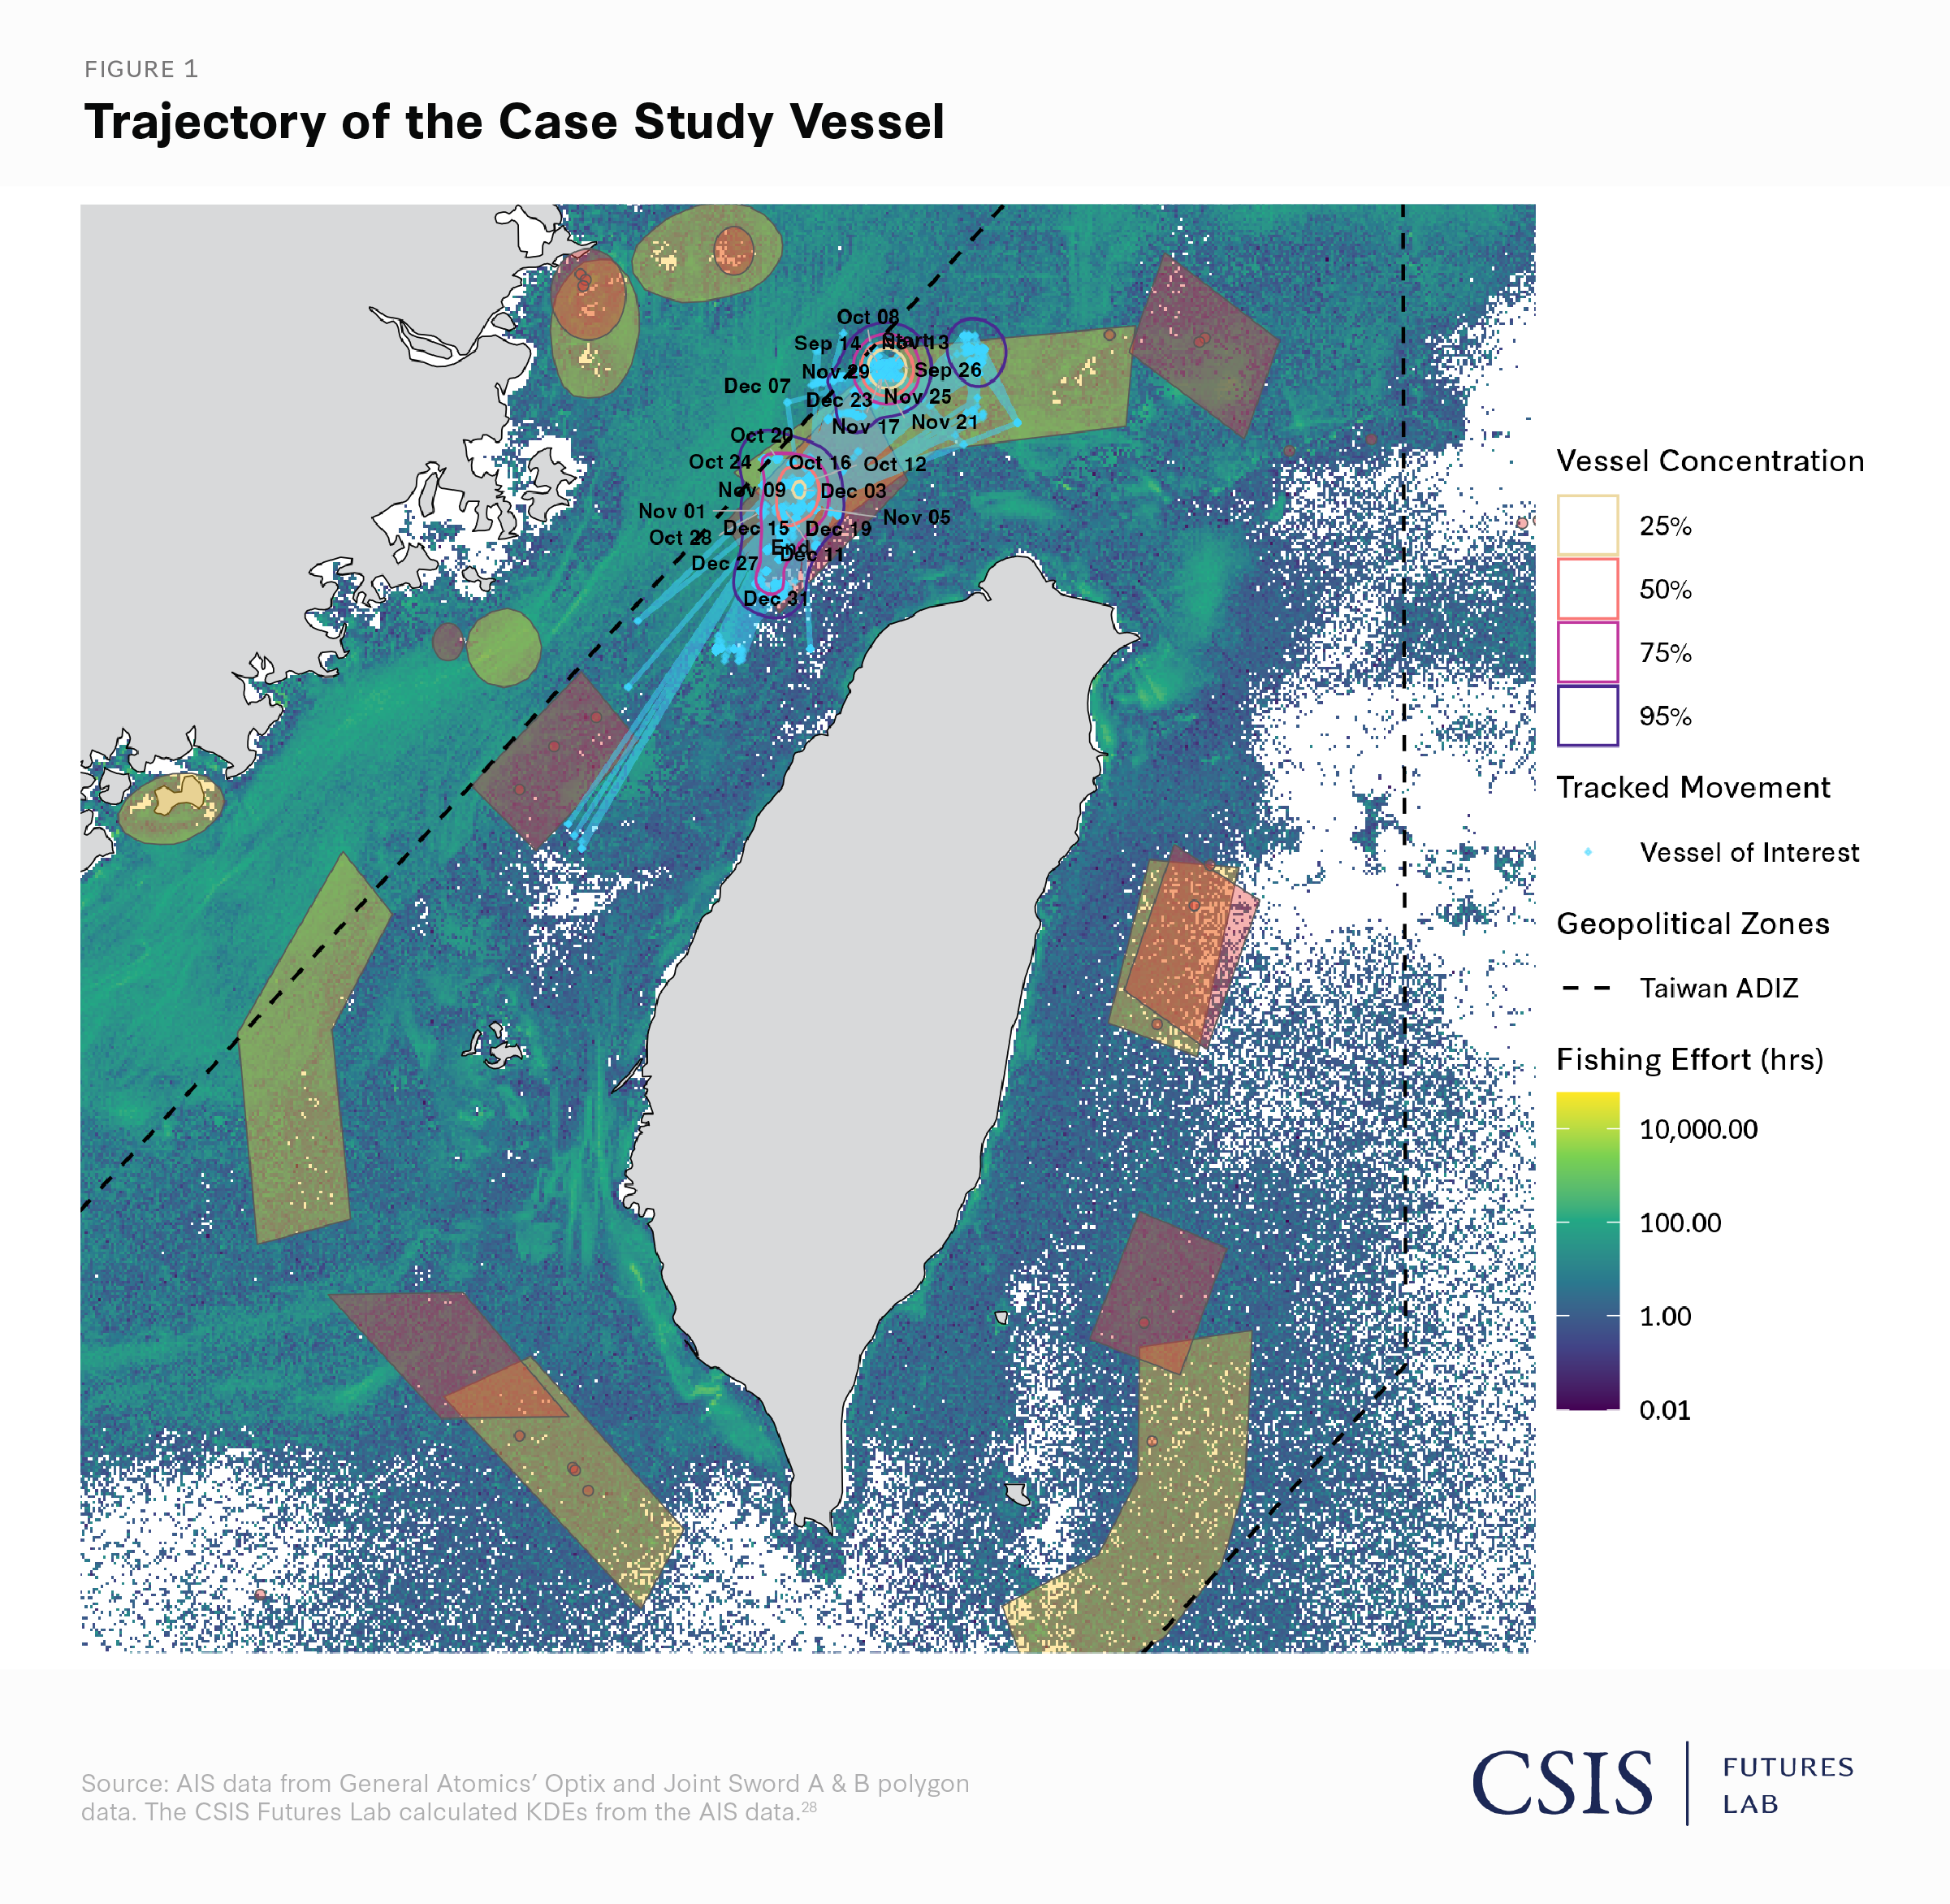
Figure 1 visualizes the profiled vessel’s operational footprint using a density estimation method (kernel density estimation, or KDE) layered atop Global Fishing Watch’s fishing effort data and known Chinese military drill zones (Joint Sword A and B). The KDE contours (25 percent, 50 percent, 75 percent, and 95 percent) represent increasing levels of spatial dispersion, with the innermost contours indicating zones of the most concentrated activity.29 This spatial analysis enables direct comparison between vessel behavior and zones of interest. As shown in Figure 1, the vessel’s (or vessels’) movements were tightly clustered within the northern Joint Sword B zone and not near fishing hotspots. The vessel’s 25 percent KDE contour, which marks its core operational area, lies squarely within a known PLAN drill zone and outside productive fishing regions. As Figure 1 incorporates the recoded data from all 11 MMSIs to showcase a more complete picture, the case study’s overall spatial pattern—combined with the vessel’s intermittent presence and unexplained absences from January to August—raises the possibility of AIS suppression or MMSI manipulation to evade detection. The integration of behavioral classification with KDE facilitates the addition of critical spatial nuance to the identification of abnormal activity. The analysis depicted in Figure 1 supplements the study of vessel behavior by adding nuance to the activity—specifically, location and intensity—thereby offering a richer understanding of strategic positioning at sea. This combined method strengthens the ability to detect gray zone tactics otherwise invisible in raw AIS tracks alone.
The persistence of gray zone activity by China requires the United States to establish a three-pronged approach to countering activities in the gray zone. First, the United States must enable deterrence by detecting and disseminating PRC gray zone activities. Second, the United States must signal the country’s resolve to counter and punish Chinese gray zone activities. This study offers transparent ways and means for the United States to operationalize deterrence by detection.30 The U.S. intelligence community can leverage unclassified ISR tools to identify gray zone activities by the PRC. The PRC is a prime target for deterrence by detection because of the country’s proven tendency to use aggression to assert ownership over disputed land or areas in the Indo-Pacific and with its neighbors.31 The United States can achieve this by publishing near-real-time anomaly feeds, effectively increasing the reputational and financial costs of Beijing’s “advancing without attacking” strategy and shrinking its plausible-deniability buffer. Further, maintaining a trove of targeting intelligence against the PRC would be instrumental in any direct war with the PLAN. This is because each interdiction or sanction deepens U.S. understanding of PRC command and control links between the PLAN, the Chinese Coast Guard, and their maritime militia, thus enabling better strategic forecasting. Third, designing an allied responsibility-sharing approach—a way to share costs for collective security—to counter the PRC gray zone activity is an optimal method for all involved to sustain collective security. Under responsibility sharing, the architecture can scale and facilitate partners to plug sensors and analysts into a joint environment, creating a counter gray zone commons in the Indo-Pacific. To this end, the following recommendations support this three-pronged strategy:
In order to enhance capabilities and visibility for DOD and military planners, establishing a standing joint operating environment in INDOPACOM will be necessary. The United States should establish a Coalition Joint-Maritime Anomaly Cell (CJ-MAC) that studies, tracks, publishes, and disseminates gray zone activities to partner countries, relevant U.S. law enforcement agencies, and U.S. agencies that can carry out punishment (e.g., the U.S. Department of the Treasury, the U.S. Department of Justice). In this manner, the whole of the U.S. government can operationalize the CJ-MAC reports by establishing a joint interagency task force for countering Chinese gray zone activities.32 In addition, informing policy practitioners about findings will lead to medium-to-longer-term horizons for peace or wartime options for countering Chinese gray zone activities.
The CJ-MAC could also leverage the Indo-Pacific Partnership for Maritime Domain Awareness (PMDA) to host allied and partner nations and enable increased sensor and analyst capabilities for a counter gray zone commons. This coalition’s staff would be trained on an open-source programming language for data analytics and use tools for the exported relevant data and queries from an AIS provider, commercial satellites, or classified ISR systems. The cell would leverage the staff’s technical expertise to cross-validate classifications of vessels with suspected gray zone activities by tasking available satellite imagery or autonomous aerial patrols for a near-real-time view of vessel activity. As such, the CJ-MAC could be able to create and internally track a repository of suspicious ships to quantify the size of a gray zone fleet so that planners can provide options for policymakers on how and when to tackle dual-use vessels. In this manner, the cell could also share intelligence with relevant partners, internal to the United States and outside it, by publishing daily suspicious vessel lists and feeding tip-offs for both operational and strategic warnings.
Increasing the international condemnation of China’s gray zone fleet is necessary to broadcast to the world the CCP’s intentions. Similar to sharing intelligence on Russian military preparations to invade Ukraine, the United States must lead the way in the Indo-Pacific by preparing a blacklist of repeat offenders that names and shames not only specific vessels, but also the companies that own or insure them.33 In this manner, the United States would continue to signal its commitment to its regional allies in the defense against PRC aggression. Further, the U.S. Treasury should consult with the CJ-MAC to receive a daily updated vessel list to review and conduct research to trace the ownership of MMSIs exhibiting gray zone activities.
The U.S. Treasury and the Intelligence Community (IC), furthermore, could leverage existing financial intelligence tools that trace the beneficial owners, ownership structure, or ranked-power coalitions back to Chinese state-owned entities or shell-owned companies. In this manner, there could be two parallel efforts to counter and deter China. First, the U.S. Treasury could sanction the relevant entities used to stand up these gray zone fleets and push joint sanction packages with European and East Asian allied or partner countries. Second, the IC could map out the level of detail at which firms are operating worldwide—from ports to shell companies based in partner and allied countries—creating opportunities for multilateral sanctions or regulatory denial of port and market access. These efforts would not only punish bad actors, but also raise the cost of doing business with China’s gray zone fleet.
To increase the visibility of the PRC’s actions in the region, the U.S. DOD could develop a public-facing dashboard that visualizes flagged vessels and PLAN drill sites within 24 hours of any activity. This tool would help the public become more informed of pressure tactics used by the PRC, as well as help allies and partner countries think about creating their own early warning or pressure detection systems concerning the PRC in the South China Sea. Since this would be an open- and crowd-sourced platform, the DOD could welcome input from the Taiwanese public and established university and nonprofit partners to contribute to a pattern-of-life validation to ensure the tools reflect the reality on the ground.
The persistence and evolution of Chinese and Russian gray zone activities are not likely to decrease as the two countries seek to change the world order. To that end, studying, evaluating, and planning for options to counter gray zone activities is imperative to the success of any conflict where the United States will encounter such activities. The United States and its allies and partners will have to explore how to engage with civil-military dual-use infrastructure, property, and life in peace and wartime. To this end, the White House could task the Office of the Director of National Intelligence (ODNI) to generate “suspicious vessel analytics,” as a standing annex to the ODNI Global Threat Assessment. The ODNI would formalize tasking for a cross collaboration, selecting agencies, commercial and academic partners, and nonprofits that are suited for the analysis and co-authoring of the assessment to ensure proper analytical tradecraft transparency.
Further, the ODNI could publish the annex in a manner that lends itself to wider public use through an open-data portal or by hosting a server available to the public via accessible programmable interfaces (APIs) to tabulate statistics or relevant analytics. This could be done similarly to how the U.S. Bureau of Economic Analysis publishes data on trade flows, or how the U.S. Bureau of Labor Statistics publishes labor statistics. By creating more access to the data, the United States can effectively treat data as a public good that can increase buy-in from partner countries or industry at large. This study itself is in part a byproduct of data as a public good thanks to the Global Fishing Watch API, its maintenance and sample code, plus developer documentation. With open-data portals to disseminate suspicious vessel analytics, the ODNI can provide routine data and briefs to policymakers and relevant allied or partner countries.
To close the final mile between detection and action, the United States must invest in targeted collection and corporate attribution. Once suspicious vessels are flagged by CJ-MAC, the DOD and IC should define “surge windows”—periods of elevated risk—and pre-task maritime domain awareness assets to collect ISR during those windows. This could include overhead imagery, signal intercepts, or drone-based surveillance to monitor personnel, behaviors, and nearby support infrastructure. Just as important, the IC should deepen analysis of the ownership structures behind these vessels. Mapping beneficial ownership, shell companies, and associated front firms will reveal whether flagged ships are tied to companies operating in allied or partner jurisdictions. This opens the door to joint sanctions, port denials, or market restrictions—tools that raise the cost of participation in the gray zone fleet. By fusing ISR, ownership data, and strategic timing, the United States can not only detect suspicious behavior but attribute it to networks with economic and political consequences. This integrated approach transforms situational awareness into policy leverage—and aligns deterrence with intelligence-led targeting.
Gray zone maritime operations leave behind behavioral signatures that can be empirically flagged, tracked, and ultimately countered. Deterrence starts with data. Integrating unclassified datasets—such as AIS-derived movement data, geospatial overlays of PLAN exercises, and Global Fishing Watch’s fishing effort analytics—shines a new light on covert, state-aligned operations masquerading as civilian activity.
These vessels are not engaged in routine commerce. They are instruments of political warfare at sea.
The findings of this study are unambiguous. Vessels spending disproportionate time in military exercise zones—while avoiding productive fishing grounds that may be within or near those zones—triggers both the behavioral proportion and absolute time thresholds developed by the research team. When layered with AIS anomalies such as going dark and identity switching, the pattern becomes even clearer: These vessels are not engaged in routine commerce. They are instruments of political warfare at sea.
Kernel density mapping adds a crucial layer of spatial fidelity, revealing that the case study vessel’s core operating area—its 25 percent KDE contour—sat squarely within Joint Sword drill zones, and far from any viable fishing waters.
This study underscores a larger strategic imperative. As authoritarian states continue to push the boundaries of the gray zone, the United States and its allies must push back and use open-source tools and scalable analytics to illuminate activity that was once deniable. Attribution is the first step in deterrence. And behavioral analytics offer a way to expose how modern military competition unfolds not just in the air or undersea, but in the subtle movements of repurposed fishing fleets operating in plain sight.
Jose M. Macias is an associate data fellow in the Futures Lab within the Defense and Security Department at the Center for Strategic and International Studies (CSIS). Benjamin Jensen is director of the Futures Lab and a senior fellow for the Defense and Security Department at CSIS.
This report is made possible by generous support from General Atomics.
Please consult the PDF for references.
The Apparent Fishing Effort dataset produced by GFW was queried for 2024 via their Application Programmable Interface (API).34 The research team processed the data in three key steps. First, the team projected the GFW point data into a Universal Transverse Mercator (UTM) coordinate system (EPSG:32651) to support spatial analysis with metric-based resolution. The team then constructed a 1-kilometer grid over the study region and assigned each point a grid_id based on its position within that grid. Next, all fishing points were aggregated into their respective grid cells and the number of fishing hours per grid were summed. This created a spatial raster of total effort, which was log-transformed to normalize the data, with each grid cell representing an intensity score of local fishing effort. The research team transformed the previously identified AIS vessel locations into the same projected coordinate system and joined each AIS point to its corresponding fishing effort grid cell.
The team downloaded the polygon files of reported areas of operation by the PLAN near Taiwan. The data was captured using web-scraping techniques that capture the polygon geometry rendered on maps from the site. The geometry data covered the area of operations by both the PLAN and CCG sighting as reported by Chinese media and Taiwanese officials.35
To narrow the timeline to search for vessel movement in the drill areas, the team assumed that suspicious vessels might maintain minimum visibility and practice formations before the public-facing drills. To evaluate the team’s assumptions and further hone in on a timeline to study, the research team used the Taiwan ADIZ violations dataset.36 The ADIZ dataset captures at a daily level the number of PLA aircraft that cross the de facto ADIZ. The team calculated the standard deviation of violations in the data to identify days when PLA sorties produced violations over the second deviation.
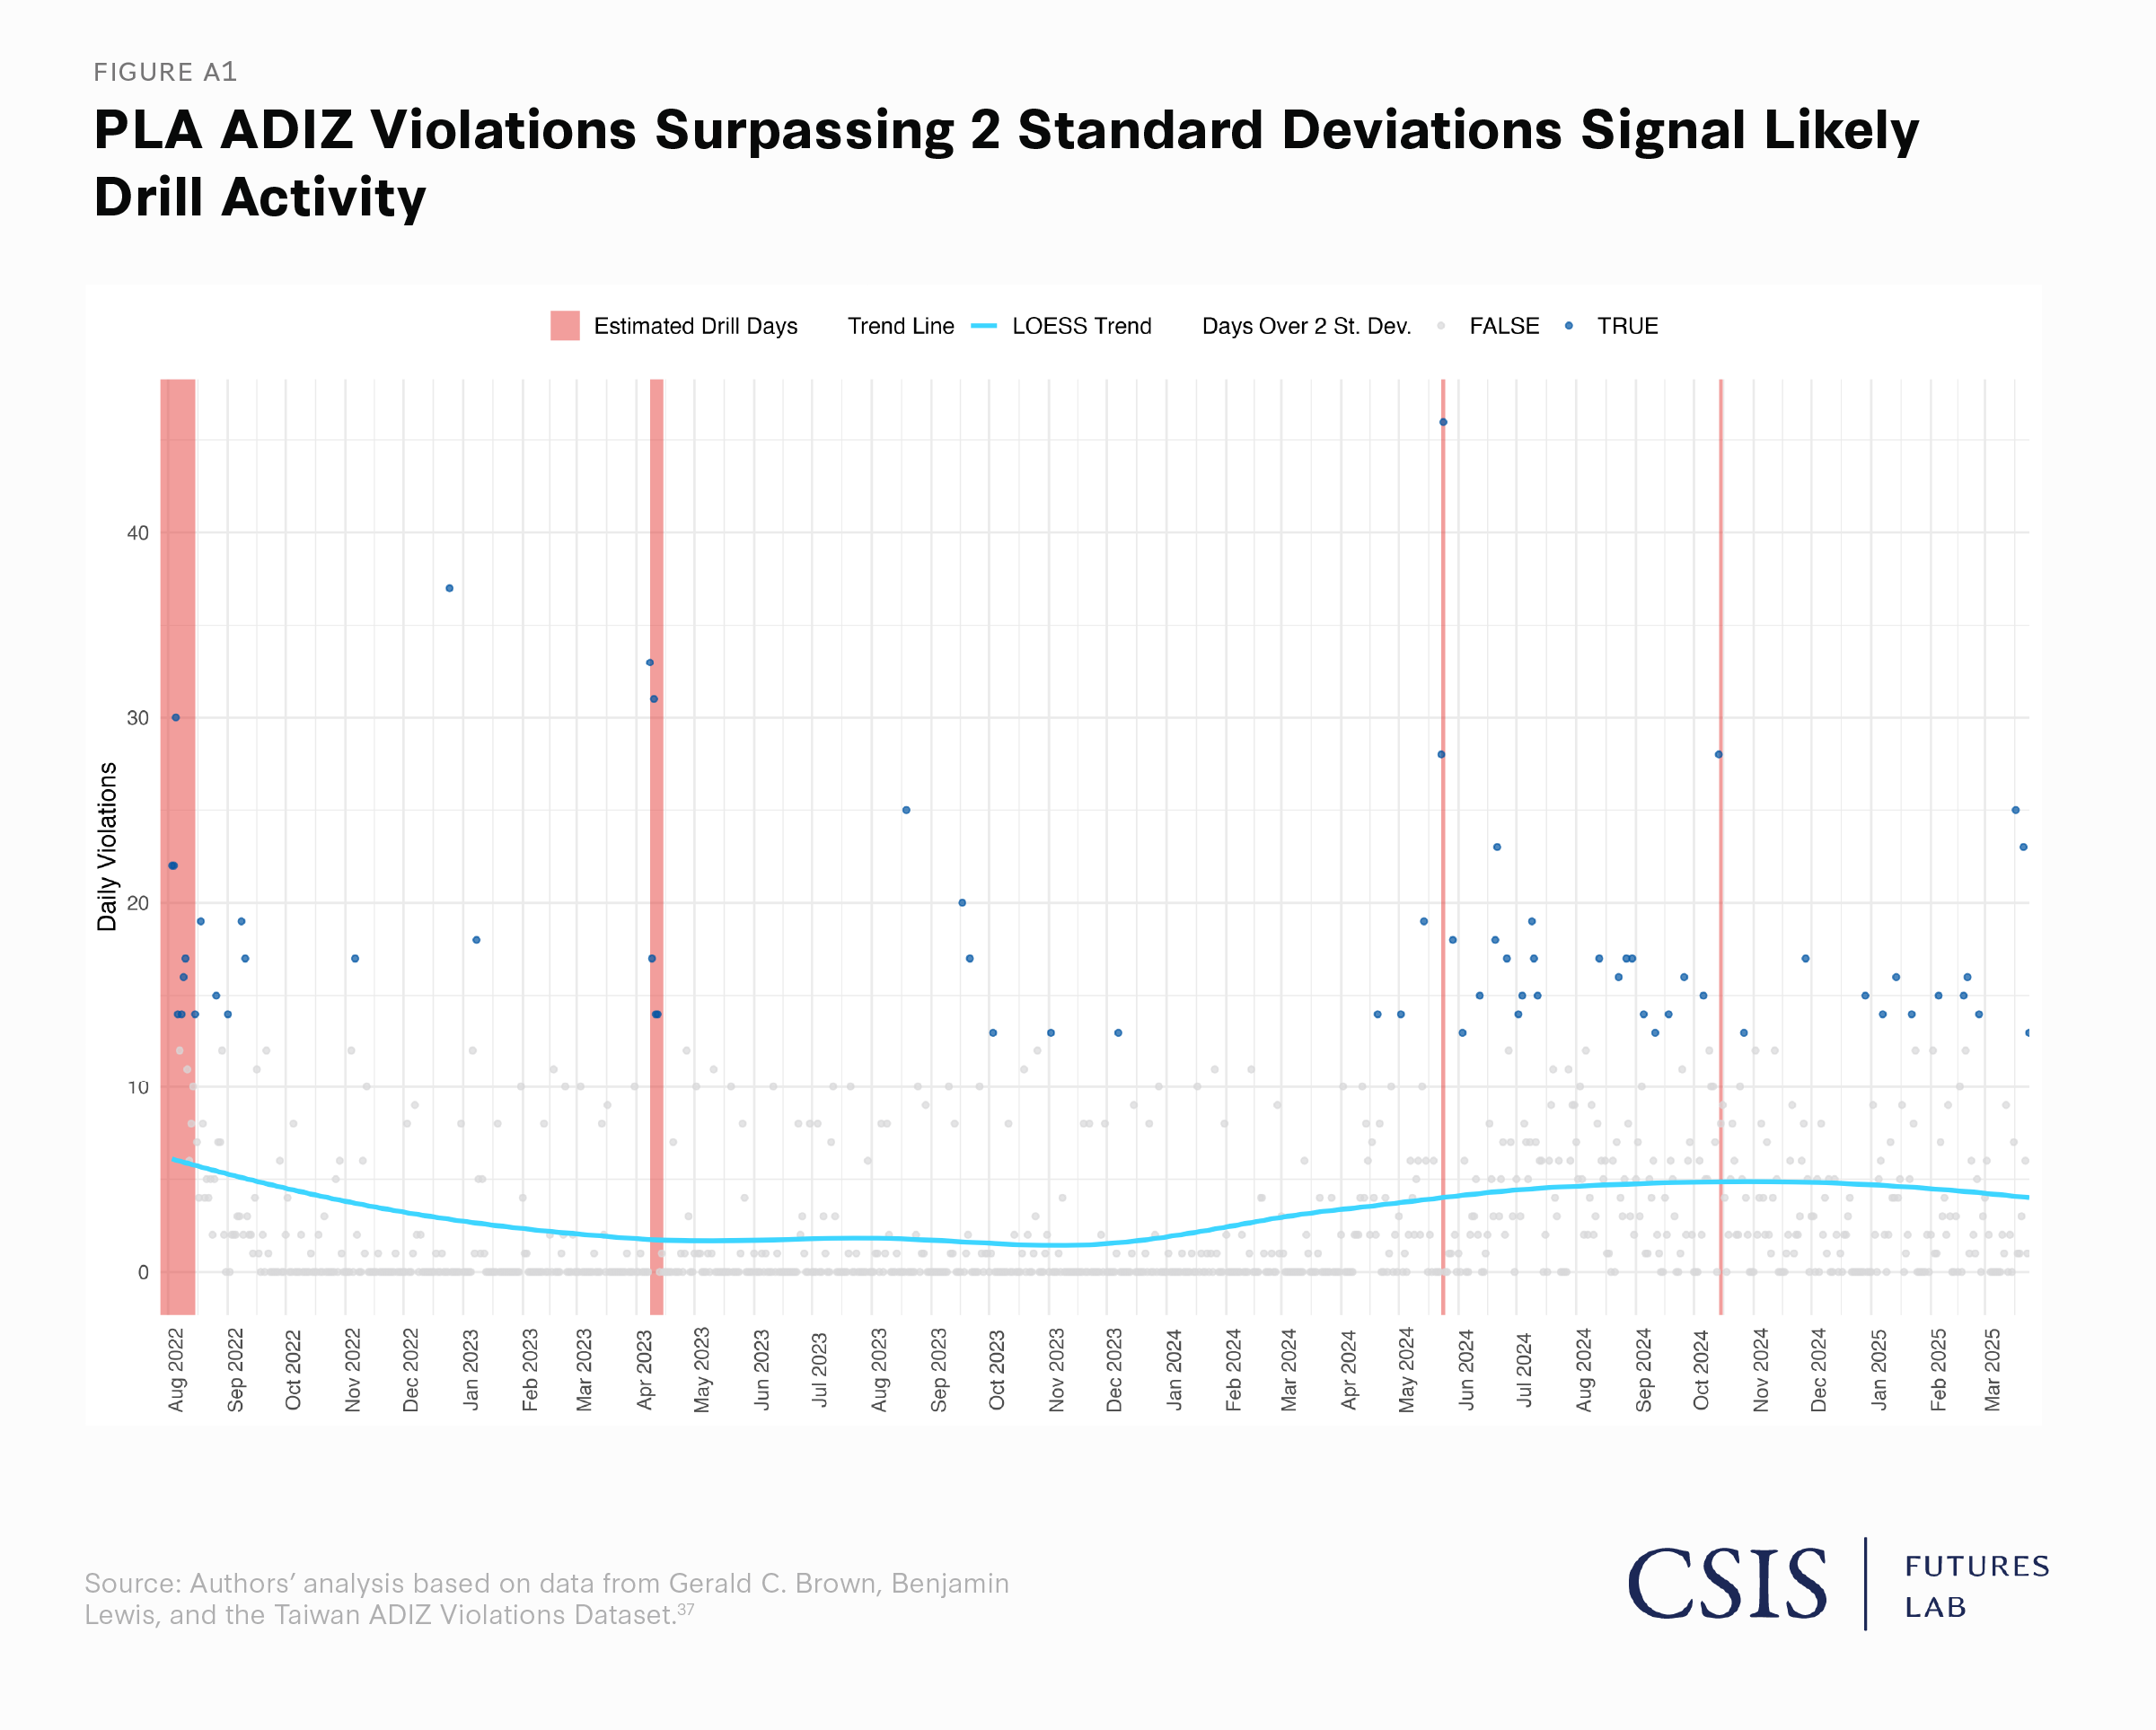
Figure A1 shows daily spikes in PLA air sorties above the 2-standard-deviation threshold, suggesting likely dates of military air activity that may coincide with PLAN maritime operations. The query dates for the data thus covered not only the drill days but expanded slightly before and after to cast a wider net for the data. This approach provided an initial vessels-of-interest list that the team used to query each vessel’s AIS movement and activities for 2024. In addition, the team calculated a local regression (LOESS) to visualize the larger trend, identifying more activity by the PLA in 2024.
Leveraging the identified dates from the ADIZ dataset, the team inputted these parameters to set the time scale. Next, the team uploaded the drill shape files and ran queries to capture any and all ships within the known area of operations. This was followed by data extraction to remove noisy data, such as buoys or fishing nets with AIS signals. A list of MMSIs was queried for ships present across the three drills that took place in August 2022 and Joint Sword, which took place in 2024. Once the MMSI list was finalized, historical queries for the MMSIs and their activities were conducted, merged, and saved at year partition levels, with 2024 containing over 12 million rows and nearly 12,000 unique MMSIs.
To classify vessels as exhibiting potentially suspicious behavior, the research team processed AIS data to calculate the time each vessel spent within high-effort fishing areas, Chinese military drill zones, and the intersection of both. Using publicly sourced shapefiles of PLAN and CCG drills (e.g., Joint Sword A & B) and high-resolution fishing effort data from Global Fishing Watch (GFW), the team assigned each AIS position a location-based context. This was achieved by overlaying AIS pings on a 1-kilometer spatial grid containing fishing intensity values, derived by aggregating apparent fishing hours in each cell. Each AIS ping was then matched with its corresponding grid cell and timestamped; the time spent in each location was computed using time differences between consecutive pings.
For every vessel, the team calculated six key spatiotemporal metrics as shown in Table A1: (1) total time in fishing hotspots, (2) time outside hotspots, (3) time inside any drill zone, (4) time inside drill zones without concurrent fishing activity, (5) percent of total time spent in hotspots, and (6) percent of time spent in drill zones only. Vessels were flagged as likely suspicious if they met either of two criteria: (1) more than 30 percent of their tracked time was in drill-only zones, while spending less than 10 percent in fishing hotspots, or (2) they spent more than 2 hours in drill-only areas while spending less than 5 percent of their time in fishing zones.
The team implemented this framework in R by calculating each of the six behavioral metrics for every vessel and applying a rule-based classification system using conditional logic. The model flags vessels as suspicious if they meet either threshold. Table A1 summarizes the variables used in the classification.
The vessels’ movements were tracked hourly and analyzed using a kernel density estimation (KDE)—a statistical method used to estimate where a vessel is most likely to have been located over a period based on AIS data—and clustered/binned into contour levels. Each percentile contour (25 percent, 50 percent, 75 percent, and 95 percent) encloses a region where the vessel spent a certain proportion of its total observed time.